
The COVID-19 pandemic is many things to many people, but for data scientists it has become an unprecedented opportunity to apply complex mathematical models to describe the spread of a pandemic that continues to defy history.
Where sites like Worldometer glibly feed a news-hungry public macbre leaderboards about the number of infections and deaths, data-analytics specialists are helping epidemiologists leverage much larger data sets – fuelling predictions about the potential spread of the disease, casualty estimates, the impact of various preventative measures, and potential forecasts about when life might begin returning to normal.
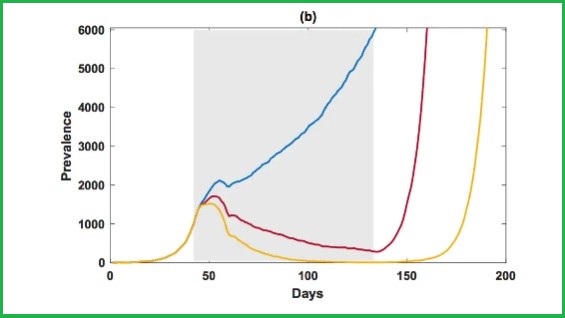
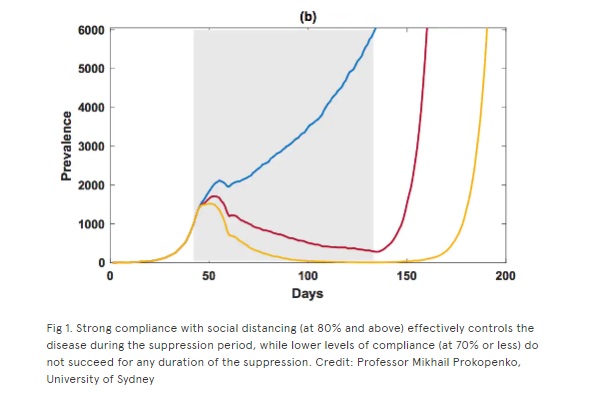
Data from a “complex model of how COVID-19 could spread in Australia”, one recent University of Sydney analysis proclaimed, had confirmed that we could control the outbreak if 8 out of 10 Australians stay home – but if the rate dropped to 7 out of 10 people, cases would continue growing out of control.
Such conclusions directly inform public-health measures and shape the nature and extent of the response – and data firms are working continuously to develop, test, and refine the models that produce the numbers.
It has been a fierce and immediate call to arms for firms like Smash Delta, a Sydney-based data-strategy firm whose normal engagements revolve around using data to answer questions around customer churn, operational efficiency, staff development, product development, profit maximisation, and the like.
The inconsistencies of COVID-19 data and forecasts had come to annoy the principals of the firm, who set out to develop an authoritative source of data about the pandemic.
“We were really frustrated with what we were hearing and seeing, whether from the public generally or people around us, not understanding the severity of where we are heading with this virus,” managing director Ben Morley-John told Information Age.
The delays between infection with the virus and presentation of its symptoms had made this pandemic particularly difficult to model, he explained, since infected individuals can spread the virus for many days before they even realise they have it.
That had led to very different mathematical models – and much higher potential rates of infection and fatalities – than those used to represent the flu, to which COVID-19 has repeatedly and inaccurately been compared.
“It’s a tricky problem to get your head around,” Morley-John explained, “because if this virus had much higher death rates and a much lower incubation time, you would see a very different public response – and they wouldn’t be questioning [lockdown] measures.”
Big-data’s promise, COVID’s reality
Yet with news reports inundated with charts comparing countries’ response to the virus and often conflicting projections about the potential spread of COVID-19 – and others flooded with misinformation that can spread on social media faster than the virus itself – helping good data float to the top can be difficult.
Contradictions between data sources can be downright confusing: the Johns Hopkins University COVID-19 global coronavirus dashboard, for example, was launched to provide detailed regional information about the epidemic – but recently suggested that Australia had already had 457 deaths (the correct number is currently 14).
Aiming to reduce misinformation and better engage citizens, tech giants are working on new ways to improve the collection and sharing of epidemiological and other data sets amongst researchers, policymakers and other key parties around the world.
Google, for one, recently began working with Carnegie Mellon University (CMU) to collect data from its users about whether they have been presenting with symptoms that could indicate a COVID-19 infection.
CMU teams have a history of success working with the US Centers for Disease Control and Prevention in modelling the flu, which gives a measure of authority to their work around COVID-19 – as does the modelling used by a new UK app that has already been downloaded by over 750,000 people.
Business-analytics firms like Tableau are offering access to “trusted” COVID-19 data for businesses that want to evaluate COVID-19’s impact on their business, and NVIDIA is giving COVID-19 researchers free access to genomic-analysis tools from Parabricks.
Meanwhile, a Microsoft-backed effort has opened up access to the COVID-19 Open Research Dataset. The World Health Organization’s GHO data repository offers researchers a wealth of COVID-19 data, big-data sharing site Kaggle is offering a host of coronavirus data sets, and the IEEE is providing a dataset that includes over 8.7m COVID-19 related tweets.
Big data has also taken a front-line role in improving the tracing of potential contacts to infected people – a key part of the COVID-19 response – with the US government moving to access mobile-phone data to trace people, Singapore launching a popular open-sourced tool that uses Bluetooth data to trace people’s movements, and countries like Israel already collecting mobile-phone data.
Ultimately, authority of data will be crucial factor in deciding which analyses to trust – and which to use for building multi-billion dollar public responses.
Establishing and maintaining that authority will be crucial as the data-science industry charges ahead as a key partner in the fight against the virus – just the kind of challenge that, Morley-John says, is “an exciting high-value problem that you can’t get solved just with a tool or a piece of technology by itself.”
“You really need people to think about something from scratch.”