

If you want to see the state of Australia’s finances, there’s no better time than tax statistics time.
The ATO reveals vast amounts of information on all sorts of companies that would otherwise play their cards very close to their chest.
Private entities and small firms alike are exposed to the light.
The lessons we can take from all this are – in places – quite surprising.
As the next chart shows, the ATO breaks down the monolithic “information, media and telecommunications” bucket into many smaller categories to permit us a much finer analysis.
It shows many things, including which industries pay most revenue to staff.
Computer system design firms, naturally, are labour intensive and their wage-to-turnover ratio is high.
Meanwhile, computer wholesaling firms have a lot of revenue that goes to suppliers.
Their wage to turnover ratio is modest.
In my experience, if you want to be paid well, it helps to be at a profitable firm.
So, a big question for many people in IT is: where are the profits?
The ATO’s data shows is profit is a slippery concept.
While gross profits are high across most of the industry (excluding internet publishing), net profits are highly variable.
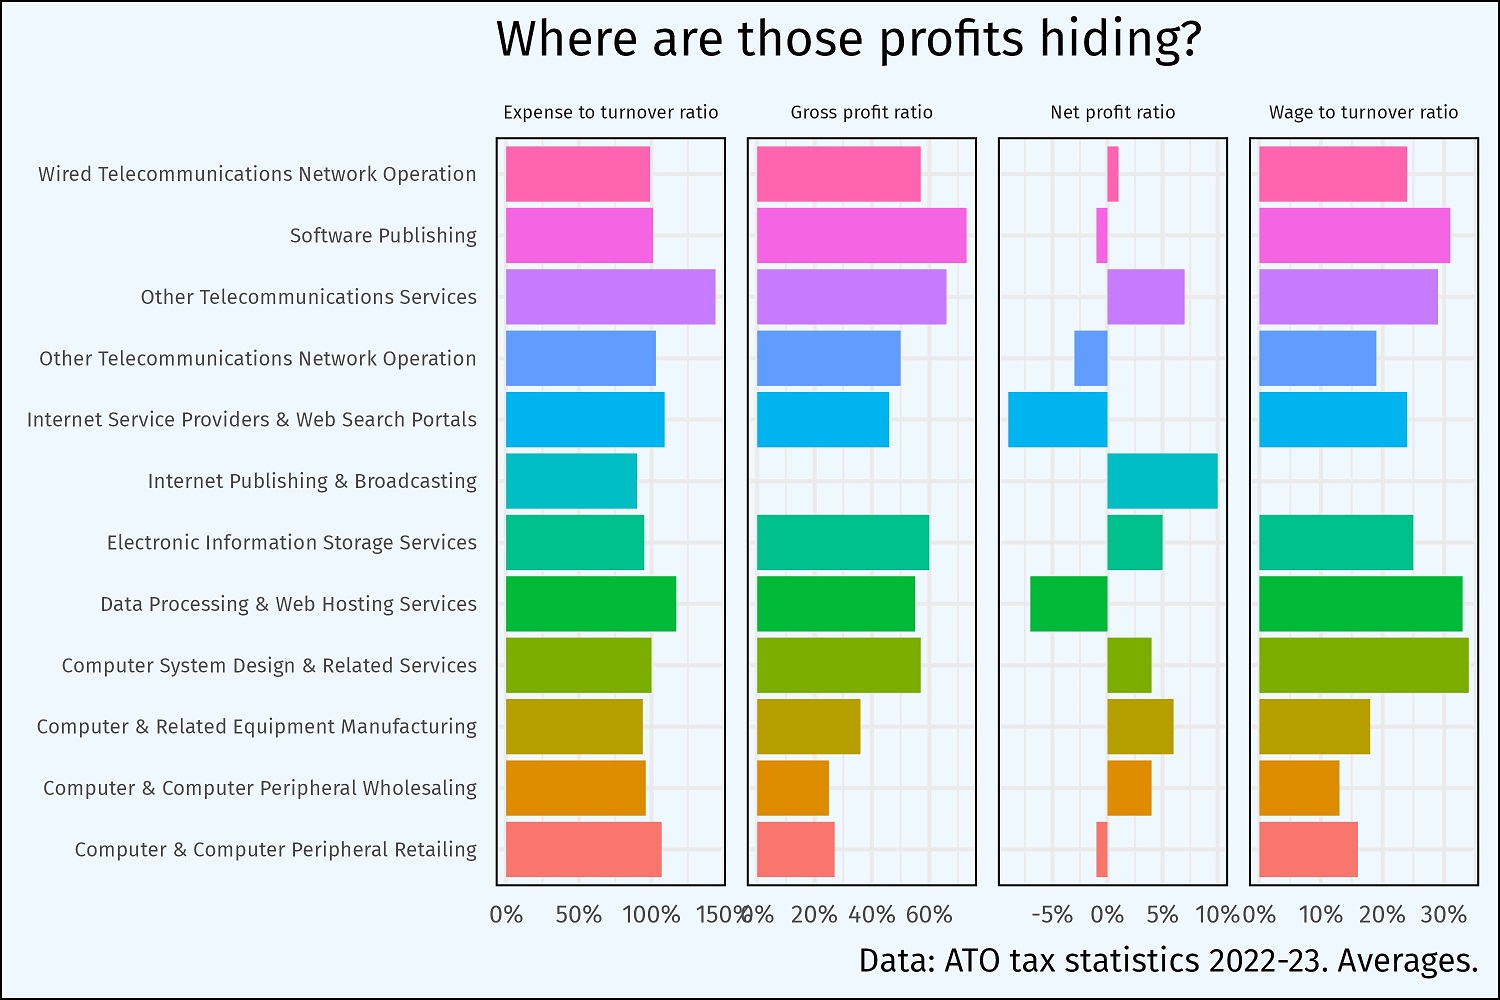
What is happening between gross and net profit there?
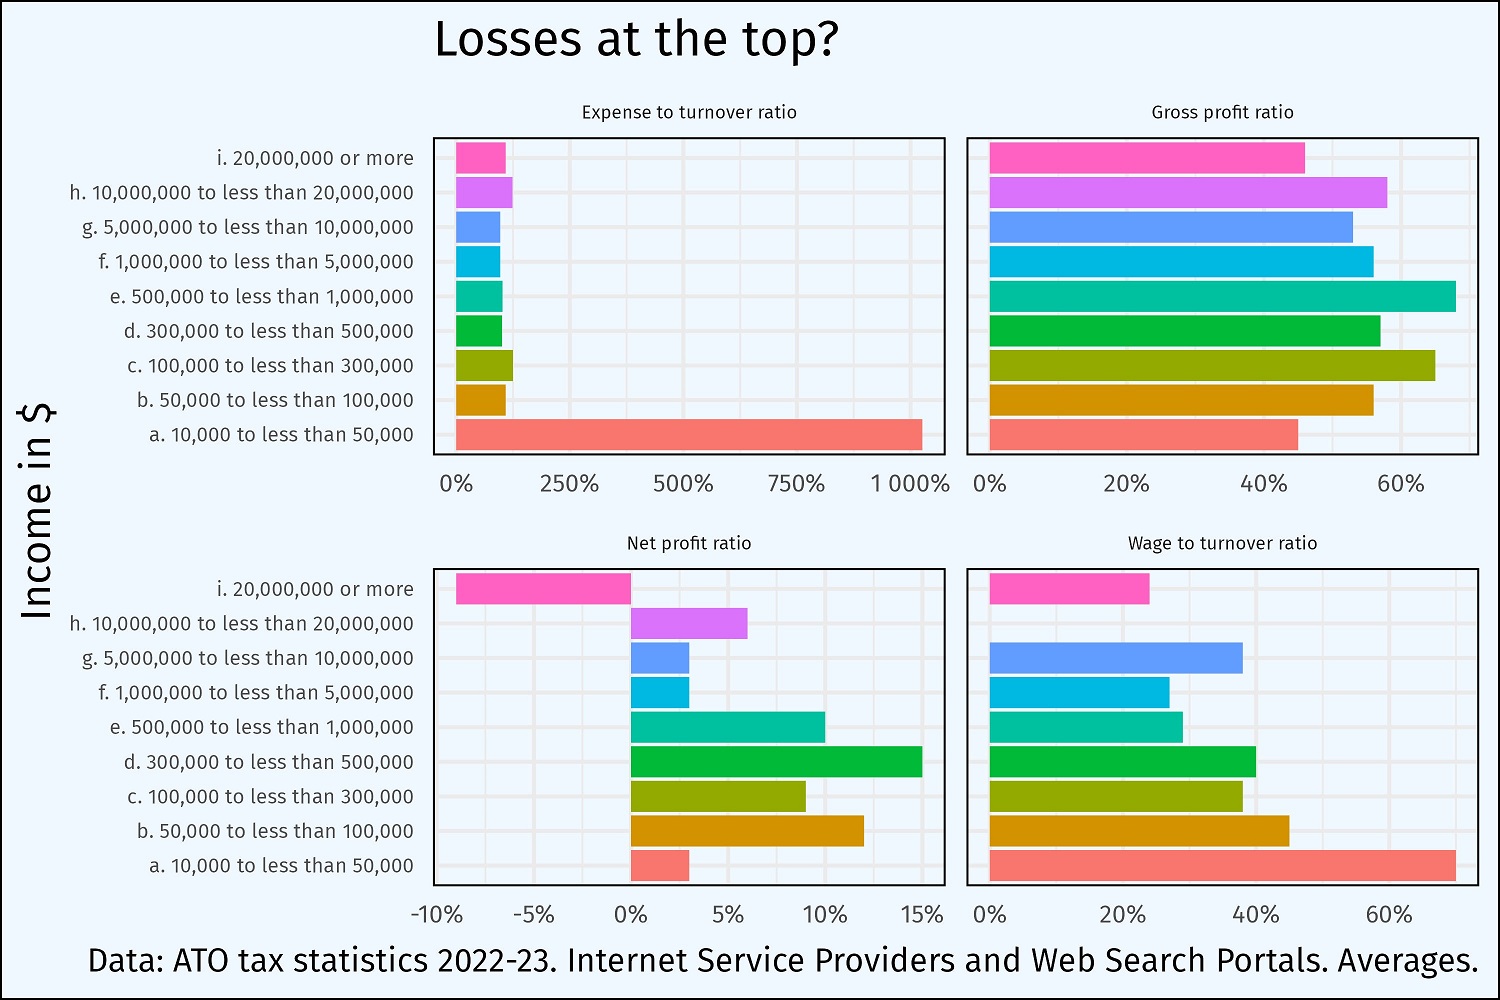
We can answer that question by zooming in on Internet Service Providers and Web Search portals.
This is a category that contains a number of household names, as well as many smaller companies.
The ATO graciously breaks down the numbers by revenue, and what we see is that the smaller firms seem quite capable of turning a profit.
The big firms are also good at turning a gross profit.
But we must assume their overheads are very high because somehow, even though they make a profit on every sale, those gross profits don’t quite seem to turn into profits on the bottom line.
Indeed, net profit is minus 10 percent.
Perhaps some of them are part of conglomerates with businesses units in low-tax jurisdictions like Ireland with whom they must share revenue.
Transfer pricing schemes have been covered in these pages before and while the ATO makes no such allegations, it would be a neat explanation for the patterns we see!
Transfer pricing is the phenomenon of one business unit in a large group demanding compensation from another for the use of its assets.
For example, if intellectual property is based in a low-tax, regime and the business units who actually serve the customers must pay to use the IP.
It can be perfectly legitimate. It can also be used as a tax minimisation scheme.
Entries and exits
Another fascinating window into the economics of the IT sector is provided by the entry and exit rates of firms.
Failure rates are modest but start rates in some segments, such as data processing, are high, suggesting high growth.
In other areas, like computer manufacturing and wholesaling, entry rates are low, suggesting slow growth.
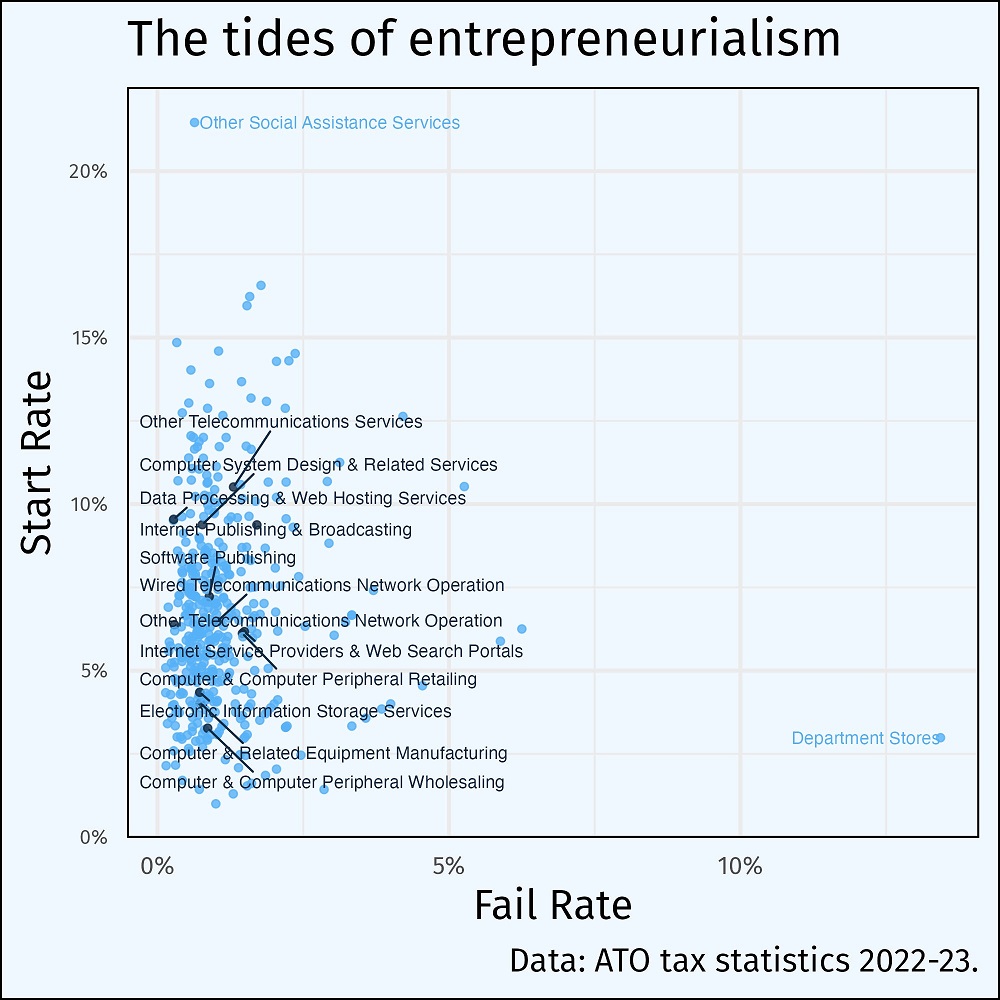
The black dots represent the IT sector and the blue dots are everything else.
The patterns overlap, suggesting the IT sector is growing at a similar rate to the economy overall.
The tax stats reveal that profits across the IT sector are growing nicely, and the industry has a higher start-up rate than fail rate, implying growth.
But despite the sunny conditions, some big firms seem to manage to have low net profits. Whether that continues or the government cracks down remains to be seen.